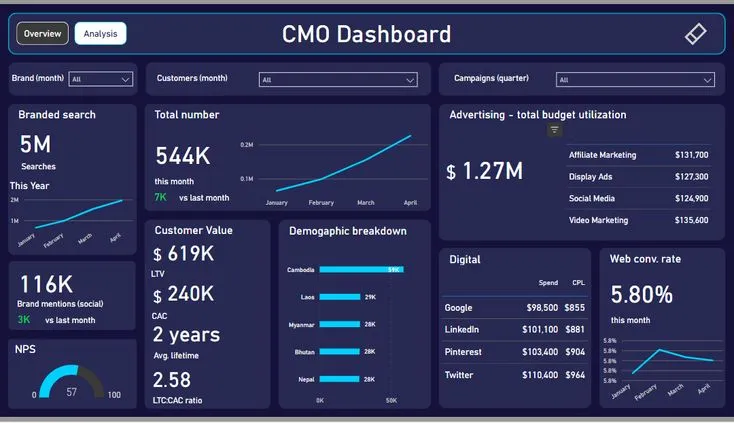
Case Study

Transforming Fleet Operations Through Business Intelligence & Data Engineering

Client Background

A leading fleet management company operating across multiple regions faced critical challenges in managing their growing vehicle portfolio, with fragmented data systems, limited visibility into fleet performance and in-efficient decision-making processes that resulted in missed optimization opportunities and increased costs.

The Challenges

Siloed Systems

Vehicle telematics, maintenance records, fuel consumption data, and driver performance metrics were stored in disconnected platforms.

Limited Analytics Capability

Management lacked real-time visibility into key performance indicators such as vehicle utilization rates, maintenance costs, and route efficiency.

Reactive Maintenance

No predictive analytics capabilities led to unexpected vehicle downtime and costly emergency repairs.

Compliance Gaps

Difficulty tracking regulatory compliance across different jurisdictions due to inconsistent data formats.

Main Objectives

Agenda of the engagement was to develop an enterprise BI platform with interactive dashboards to enable client make informed decisions.

Executive Dashboard

Fleet-wide KPIs, cost trends, and operational
performance metrics.

CMO Dashboard displaying branded search statistics, total number 544K this month, customer value with LTV 619K and CAC 240K, advertising budget utilization of $1.27M, digital spend and cost per lead on Google, LinkedIn, Pinterest, Twitter, and a web conversion rate of 5.80%.

Operations Dashboard

Vehicle tracking, Engine alerts optimization, and notifications.

Financial dashboard showing earnings of $984.42, spending of $576.76, savings of $421.29, balance summary graph, credit card details, quick transaction contacts, admit snap chart, customer growth bubbles, expenses summary with total $9670, and transaction history with a $1,000 PayPal payment.

Maintenance Analytics

Preventative maintenance alerts, service history, and
parts inventory.

Person interacting with a virtual analytics dashboard displaying colorful charts, graphs, icons, and performance metrics over a laptop keyboard.

Driver Performance

Fuel efficiency checks, and compliance monitoring.
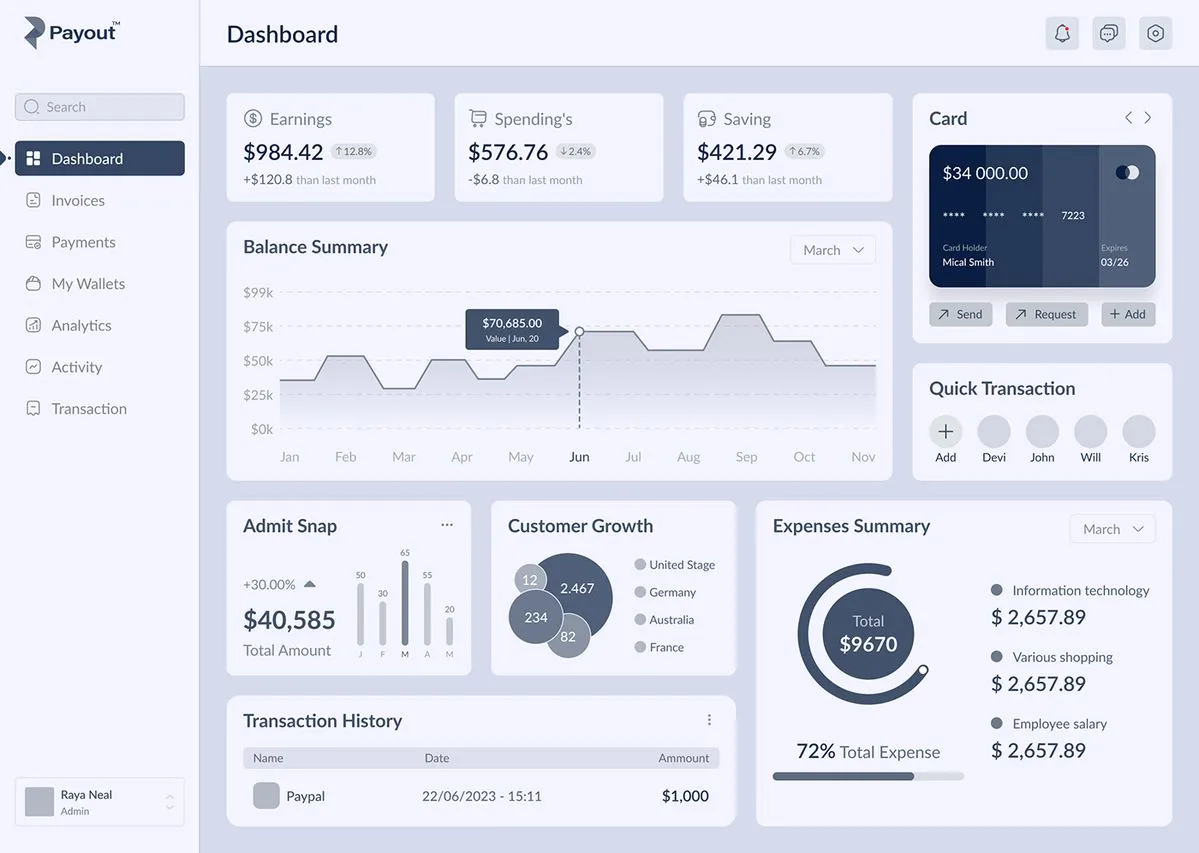
Financial Analytics

Cost Analysis, Repair & Average Cost details and Budget variance & Benchmark analysis.

Person viewed from behind interacting with multiple floating digital data screens in a futuristic virtual environment.

Technologies and Tools

AIM’s multidisciplinary team leveraged its digital transformation framework based on best practices from Gartner’s TIME model, NIST SP 800-34, COBIT, and ITIL standards. The engagement included analysis of the client organization’s Azure-based cloud infrastructure, on-prem systems, and third-party tools used by the partner organizations.
Results / Expected Outcomes
  • A unified digital roadmap for all the partner organizations that supports integrated service delivery.
  • Identification of a shared IT governance framework for coordinated decision-making and long-term sustainability.
  • Improved data interoperability and privacy alignment across organizations.
  • A clear procurement and implementation roadmap that guides future investment decisions.
  • Enhanced readiness for cloud adoption and cybersecurity resilience, informed by AIM’s NIST-based assessment methodology.
  • These outcomes are expected to strengthen the partners’ collective ability to deliver equitable, accessible, and data-driven health services to the target population in the regional community.
Hand holding a digital checkmark surrounded by futuristic blue icons representing settings, analytics, security, and global connectivity.

Conclusion

This collaboration demonstrates the transformative power of applying advanced analytics to solving specific, practical business challenges.

Solution implemented enabled client to achieve data and analytics maturity in terms of:

  • Established single source of truth with 99.5% data accuracy across all operational metrics
  • Created self-service analytics culture with C-suite regularly accessing dashboards independently
  • Real-time visibility into 100% of fleet operations with dashboards accessible across all organizational levels
  • Deployed 18+ dashboards in production supporting proactive decision-making